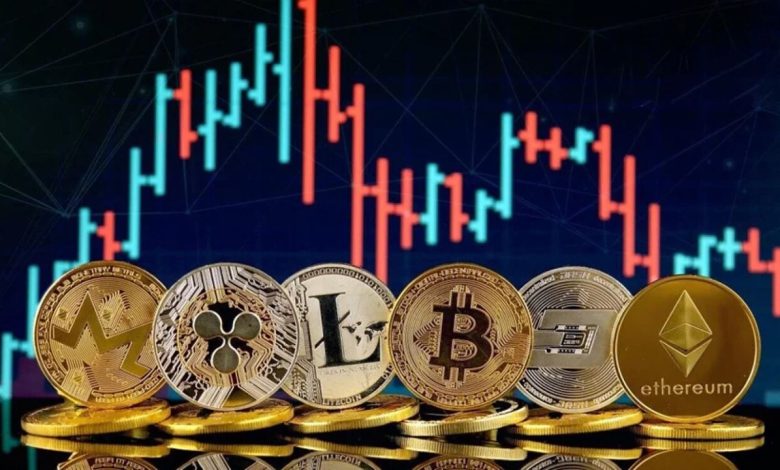
The influence of digital currencies has led to a surge in interest among individual investors, institutional players, and technology enthusiasts. The blockchain serves as the decentralised ledger underpinning these currencies, containing a constantly updating database of transaction details and ownership records. This technology has paved the way for transparent and easily accessible data on trading volumes, price fluctuations, and market sentiment. While such data is theoretically available to anyone, the real challenge lies in presenting and interpreting it in a way that drives insights and supports timely decision-making. This is where the power of JavaScript Charts becomes apparent, especially for those seeking interactive, real-time visualisations of blockchain data within web applications.
According to a developer from SciChart, “One crucial piece of advice is to ensure that the charting library you choose can handle large volumes of data without sacrificing performance or interactivity. Tools like our JavaScript chart library are specifically designed to manage complex datasets in real-time, which is essential for live blockchain analytics.”
Blockchain Data and Its Impact on Digital Currencies
At the heart of digital currency analytics is a system that logs vast amounts of data in blocks linked together to form an unchangeable record of transactions. Each block confirms the valid operations, such as the transfer of coins between wallets, and is cryptographically secured to prevent tampering. Because it is distributed, the blockchain’s ledger is not stored in a centralised location but shared across thousands of nodes around the world. The transparency of this arrangement allows anybody to examine digital currency data once they connect to the network. Investors, traders, and data enthusiasts can see how transactions flow in real time, track the movement of large coin holdings, and even observe changes in market sentiment by analysing public addresses.
The deep transparency offered by the blockchain has many ramifications. Anyone with the technical expertise can query on-chain records to see when specific wallet addresses made transactions, how many tokens were transferred, and even the origin of those tokens. However, raw data can be overwhelming without an appropriate method of synthesis and interpretation. Minute-to-minute changes, large spikes in transaction activity, or the emergence of so-called “whale” wallets can be overlooked if one simply combs through tables of numbers. To remain competitive, those in the digital currency industry must quickly recognise trends, identify anomalies, and form well-grounded hypotheses on where the market is heading. Visualisation tools excel here, as they can capture complex changes in numerical variables and transform them into instantly recognisable patterns.
The need to visualise blockchain data resonates with both traders and developers. Traders depend on real-time graphs of price movements and transaction volumes to spot trading opportunities. They are interested in quickly adjusting their positions once they see an upward or downward movement. Developers, on the other hand, must ensure their applications—be they crypto exchanges, portfolio trackers, or blockchain explorers—present data in a way that is not only engaging but also accurate and responsive to frequent changes. When blockchain data is appropriately aggregated and shown through dynamic charts, it becomes significantly easier for stakeholders to act upon new insights and respond to the high volatility and unpredictability of the crypto markets.
Challenges in Handling Blockchain Data for Visualisation
Although the transparency of the blockchain allows unlimited access to on-chain data, the mechanics behind storing and querying this information can be intricate. The sheer volume of transactions on popular blockchain networks requires that any system retrieving data be optimised for speed and reliability. Parsing the data often involves interfacing with node clients or block explorers, each providing raw transaction details, block heights, timestamps, and other critical parameters. Even after setting up an efficient method to mine this data, a second challenge appears in how to clean, parse, and present it. Outliers must be addressed, duplicates removed, and the data normalised to ensure consistency in the final representation. Moreover, the decentralised nature of digital currencies means the data is being updated constantly, every few seconds or minutes, depending on the specific blockchain in question.
Another hurdle to overcome lies in the application layer. Some older libraries might struggle with fast updating speeds and large datasets. For instance, if you want your exchange platform or analytics dashboard to handle thousands or even millions of data points across multiple different coins, standard tools might quickly become overwhelmed. This results in performance bottlenecks, such as slow loading times or unresponsive chart interactions. A high-performance charting solution must be chosen to integrate seamlessly with the volume and complexity of blockchain data. For many, this entails selecting a specialised library with optimised rendering and robust real-time data features, ensuring that the user experience remains fluid even during peaks in network activity.
Approaches to Blockchain Data Visualisation
Developers looking to present blockchain data in an approachable format generally follow a few key steps. First, they must decide which metrics they want to track: trade volume, the number of daily active addresses, price changes, transaction throughput, or any of the numerous other possibilities. Once these core metrics are selected, the next step involves choosing how to derive the underlying data. This might require tapping into exchange APIs, connecting to a full node, or using third-party data service providers that specialise in blockchain analytics.
After the data has been retrieved and aggregated, it is passed to a front-end interface that renders various types of charts. Developers often choose frameworks and libraries that align with the technology stack of their web application. If they are building in React, for instance, they might opt for a React-specific charting library. Others using Vue or Angular would prefer libraries that integrate well into those ecosystems. Regardless of the framework, an efficient charting solution should support zooming, panning, tooltips, and real-time updates, features that are particularly valuable for displaying blockchain data to an audience intent on quick reaction times.
An added complexity arises in bridging data from multiple blockchains. For those interested in cross-chain metrics—tracking the relative performance of different coins, or following assets that move between chains via bridging solutions—visualisation becomes even more essential for highlighting divergences or convergences in market performance. Tools that can merge multiple data streams and render them together on the same dashboard improve the user’s ability to compare different chains side by side. This can be done by layering multiple time-series lines on one chart, or by splitting them across different chart panels, each representing a specific data dimension.
Historical Perspective: The Emergence of Crypto Analytics Dashboards
When Bitcoin first began gaining traction, data enthusiasts relied on basic price charts and blockchain explorers to get a glimpse of on-chain activity. However, these initial tools were rudimentary, often displaying raw text-based logs of transactions and basic price feeds. The demand for more advanced analytics grew in tandem with Bitcoin’s popularity, prompting entrepreneurs and open-source developers to step in and provide robust solutions that collected, aggregated, and visualised vast amounts of information. Eventually, websites dedicated to crypto analytics burst onto the scene, featuring advanced dashboards that allowed users to track price trends, order book depth, and even measure social media sentiment.
These evolutionary changes in crypto analytics reflect a shift in how data is viewed and handled. The on-chain data, once considered a niche interest only for developers, became critical knowledge for investors and traders. The line between purely technical blockchain data and financial market data blurred, as these fields intersected in real-time transactions, decentralised finance projects, and initial coin offerings. The result was a growing emphasis on user-friendly visual interfaces, which would enable the average crypto enthusiast to interpret complex metrics. Among these dashboards, the use of JavaScript-based charting libraries took centre stage, thanks to their cross-platform compatibility and relatively straightforward implementation across different web applications.
Real-Time Analytics and Market Sentiment
One key reason behind the popularity of blockchain data visualisation lies in the demand for real-time analytics. Traditional financial markets are used to live updates, with ticker prices changing every second on stock exchanges. The crypto market, by virtue of its round-the-clock trading cycle, follows a similar pattern but without any pauses. Prices can shift dramatically within minutes or even seconds. Traders often rely on candlestick charts that display price data in intervals of one minute or less, combined with volume bars indicating transaction volume. Layered indicators, such as moving averages, Bollinger Bands, or relative strength indices, are also frequently used to analyse trends and predict future price movements.
On-chain data provides a layer of insight that extends beyond mere exchange prices. The blockchain can show wallet distributions, revealing whether large players (whales) are accumulating or offloading coins. Analyses of wallet movements into or out of exchanges can signal broader market shifts—if tokens are moving en masse into an exchange, it might suggest looming sell pressure, for instance. These factors can be crucial when deciding on a trading strategy, and effective data visualisation can highlight these patterns quickly.
Moreover, data visualisation is not only for professional traders with specialised knowledge. Everyday investors and enthusiasts are also hungry for easily interpretable data that allows them to keep tabs on market sentiment and price trends without having to run complex queries. An engaging front-end that enables them to toggle time ranges, overlay indicators, or switch between log and linear scales fosters a sense of control and confidence. By adapting the data presentation to different expertise levels, developers and product owners can reach a broader audience while still offering advanced functionalities for power users.
Security, Transparency, and Trust
In the realm of digital currencies, trust is paramount. The popularity of certain blockchain networks stems partially from the belief that transparent, unalterable ledgers lend credibility to the digital assets in question. Visualisation plays a significant role in maintaining that trust. By providing clear graphs that show the health of a network—uptime, average block times, or the number of active nodes—developers can reassure users that the network is functioning correctly and that their transactions are secure. This can be augmented by showing the hash rates for proof-of-work blockchains or stake distributions for proof-of-stake networks. By bringing these technical metrics to the forefront in a user-friendly manner, projects can demonstrate their commitment to openness and reliability.
Transparency does not only relate to network-level health, but also to projects building on top of the blockchain. For instance, decentralised finance (DeFi) platforms rely on smart contracts that automate actions like lending, borrowing, and trading. Visual dashboards that display total value locked (TVL), interest rates, user adoption, and liquidity can help build confidence among potential users. When such data is displayed accurately and attractively via advanced charts, it acts as a source of reassurance. Users can see that they are depositing funds into a contract with sufficient liquidity and that the contract has a robust user base.
Blockchain-based fundraising events such as initial coin offerings (ICOs) or token sales similarly benefit from data transparency. Real-time data can show how much capital has been raised, how many participants are involved, and the pace at which tokens are being sold. This prevents confusion and fosters a sense of openness. Investors can track progress and make more informed decisions about whether to increase or reduce their participation. As more regulations arise to protect investors, transparent data visualisation tools will likely become standard practice in legitimising digital currency projects.
Handling Scalability and Performance
Projects that monitor numerous cryptocurrencies on multiple blockchains must consider scalability as a crucial factor. Blockchain data can become extremely large over time, demanding architectures that efficiently query and process information. Caching and data warehousing solutions become indispensable in retrieving historical data quickly, while also allowing for real-time updates. The front-end must be capable of responding to user interactions, whether that involves zooming in on a specific time range or toggling between different data streams. A chart that stalls or lags under the strain of large data sets quickly loses its utility, especially in the fast-paced crypto market.
Developers can use a variety of optimisation strategies. This might include client-side data decimation, which removes redundant data points while preserving the essential shape of the graph, or server-side aggregation of data at different time intervals. Adaptive rendering techniques, where charts dynamically adjust their display resolution or data granularity based on the user’s actions, can also be implemented. By ensuring that the charting library is capable of rendering tens of thousands of points without losing performance, developers cater to a broad audience, from casual observers tracking one or two tokens to professionals scrutinising a large basket of assets.
Comparison Across Multiple Digital Currencies
One of the more interesting areas of blockchain data visualisation is comparing different digital currencies. Ethereum, for instance, introduced smart contracts, enabling an entire ecosystem of decentralised applications to flourish. Meanwhile, other blockchains might focus on high transaction throughput, privacy features, or bridging different networks. Visualising key metrics across multiple chains—like transaction speed, transaction costs, or market capitalisation—reveals how these projects differ in terms of utility and adoption. This can be done by plotting side-by-side bar charts of daily transactions or layering multiple lines representing transaction fees over time.
When designed properly, comparative dashboards become a go-to resource for those hoping to diversify their crypto portfolios. For example, an investor might want to see how transaction fees on Ethereum stack up against a competing chain, or how daily active addresses vary between different ecosystems. The data gleaned from such comparisons can influence decisions about portfolio allocation and risk management. The ability to capture data from multiple APIs, parse it in a uniform manner, and present it clearly requires careful planning but offers significant benefits for user understanding.
Candlestick Charts and Technical Analysis
Technical analysis has been part of traditional financial markets for decades, involving a focus on price charts, volume patterns, and various indicators to forecast price movements. In the context of digital currencies, candlestick charts are extremely popular because they display open, high, low, and close prices for each time interval. Adding data overlays such as moving averages helps identify long-term trends and potential breakout or breakdown points. Bollinger Bands or the relative strength index (RSI) can provide clues about momentum or potential reversals. When merged with on-chain data, these charts become even more powerful, as one can look for correlations between on-chain transactions and price changes.
Some advanced traders incorporate event-driven strategies—waiting for on-chain data to confirm a large coin transfer to an exchange, for example, then reacting quickly based on historical patterns that suggest impending selling pressure. Visualising this relationship between whale movements and subsequent price volatility helps maintain clarity. Candlestick charts are particularly well-suited to capturing the nuanced changes that accompany real-time transaction data, so long as the charting solution is performance-optimised and offers a clear interface for users to interact with and interpret the data.
Regulatory Impact and Evolving Requirements
As digital currencies gain mainstream acceptance, governments around the world are increasingly looking to regulate this space. Exchanges and other financial service providers must comply with anti-money laundering (AML) and know-your-customer (KYC) regulations, while different regions impose varying requirements around tax reporting and capital controls. Accurate and timely data visualisation becomes instrumental in satisfying these regulatory demands. Companies can track large transactions and suspicious movements on the blockchain by building compliance dashboards that integrate directly with on-chain analytics. Regulators themselves can use such visual dashboards to gain insight into market behaviour, detect fraudulent schemes, and inform policy.
The growing emphasis on stablecoins—digital currencies pegged to real-world assets such as fiat currencies—raises further data-tracking needs. Projects that issue stablecoins must maintain reserves and demonstrate transparency in their operations. Live dashboards can show proof-of-reserves, displaying at any moment whether the tokens in circulation match the backing assets. This is made possible by connecting to multiple data sources, from the blockchain for on-chain transactions to traditional financial APIs for real-time valuation of reserve assets. Charting tools that combine these different data streams in an intuitive manner help maintain public confidence while addressing regulatory oversight.
Enhancing User Experience Through Interactive Visualisations
Beyond merely presenting static graphs, modern web applications place a premium on user interactivity. Features such as hover tooltips, zooming, or the ability to switch between linear and logarithmic scales can make a significant difference in how users interpret data. Interactive visualisations encourage deeper engagement by allowing users to focus on data subsets of particular interest. When users can highlight a specific time interval to study price behaviour or examine transaction spikes, they develop a richer understanding than they would by looking at a fixed chart.
For blockchain projects that target mass adoption, intuitive and interactive visuals can help bridge the knowledge gap for newcomers. They reduce the steep learning curve of on-chain analytics by presenting essential data in a digestible form. A well-crafted user interface can provide contextual explanations, prompting users with relevant information as they scroll or zoom. Meanwhile, more advanced users can rely on custom overlays or set their own alert thresholds, receiving notifications if certain parameters exceed predefined limits. This level of engagement transforms raw data into a compelling story about the market’s behaviour and potential future direction.
Future Prospects and Innovation
As blockchain technology continues to evolve, data visualisation tools will likely become more integrated with artificial intelligence and machine learning. Predictive models that analyse past market cycles, large volumes of trades, and user behaviour patterns can be merged with charting tools to offer forward-looking insights. Developers are experimenting with ways to automatically highlight data anomalies—such as sudden transaction spikes or unusual wallet movements—using predictive analytics that can foresee potential price swings or emphasise interesting market trends.
Decentralised exchanges and automated market makers present another frontier for data visualisation. These platforms allow users to trade directly from their wallets without an intermediary, but also generate a wealth of on-chain data regarding liquidity pools, yield farming opportunities, and token swaps. Presenting these details in a user-friendly format requires sophisticated tools that can handle constantly evolving data flows and potentially large volumes of transactions in multiple currency pairs. As more participants enter the DeFi space, the demand for high-performance visualisation will continue to grow, ensuring that the technology behind chart rendering and data handling advances in tandem.
The Role of Community-Driven Tools
One of the appealing aspects of blockchain technology is its open, community-driven ethos. This fosters an environment where independent developers, data scientists, and even hobbyists collaborate on new analytics dashboards and data indexing solutions. Open-source charting libraries and frameworks have gained considerable traction, powered by a collective desire to improve and adapt the tools to meet evolving market needs. This dynamic interplay of community input and professional development has given rise to a variety of tools that can be customised for specific use cases, including tracking niche digital currencies or focusing on certain on-chain metrics.
However, the open-source route is not always the right choice for every project. Some enterprises operating at large scale prefer commercially supported libraries that offer professional features and guaranteed performance. They might require detailed documentation, dedicated support channels, and advanced functionalities like annotation layers or server-side rendering. Regardless of the approach—open-source or commercial—community and corporate contributions have advanced the field significantly, providing a wide array of options for blockchain data visualisation.
Conclusion
The remarkable growth of digital currencies over the last decade has highlighted the necessity of clear and reliable data visualisation tools. Blockchain technology inherently generates a wealth of real-time data, from transaction volumes to network health metrics, all of which can be invaluable in understanding market trends and spotting opportunities. Charts, especially those implemented using robust libraries, offer an intuitive window into this complex world, enabling traders, analysts, developers, and everyday users to observe and interpret the ebb and flow of on-chain events. While the market can be volatile and replete with risk, well-designed data visualisation serves as a powerful ally by making it simpler to track activity and make informed decisions.
As blockchain continues to evolve, supported by constant innovations in decentralised finance and diverse consensus mechanisms, the demand for advanced data visualisation solutions will only intensify. Whether one focuses on tracking large whale movements, comparing multiple chains for strategic investments, or simply wants to review real-time price and volume data, the right approach to visualising blockchain data can make a difference between merely reacting to events and proactively predicting them. In this rapidly changing environment, robust JavaScript Charts and well-structured data pipelines are essential components of any serious crypto analytics strategy, ensuring that information remains not only accessible and insightful but also visually captivating for a global audience eager to engage with the financial technology frontier.


